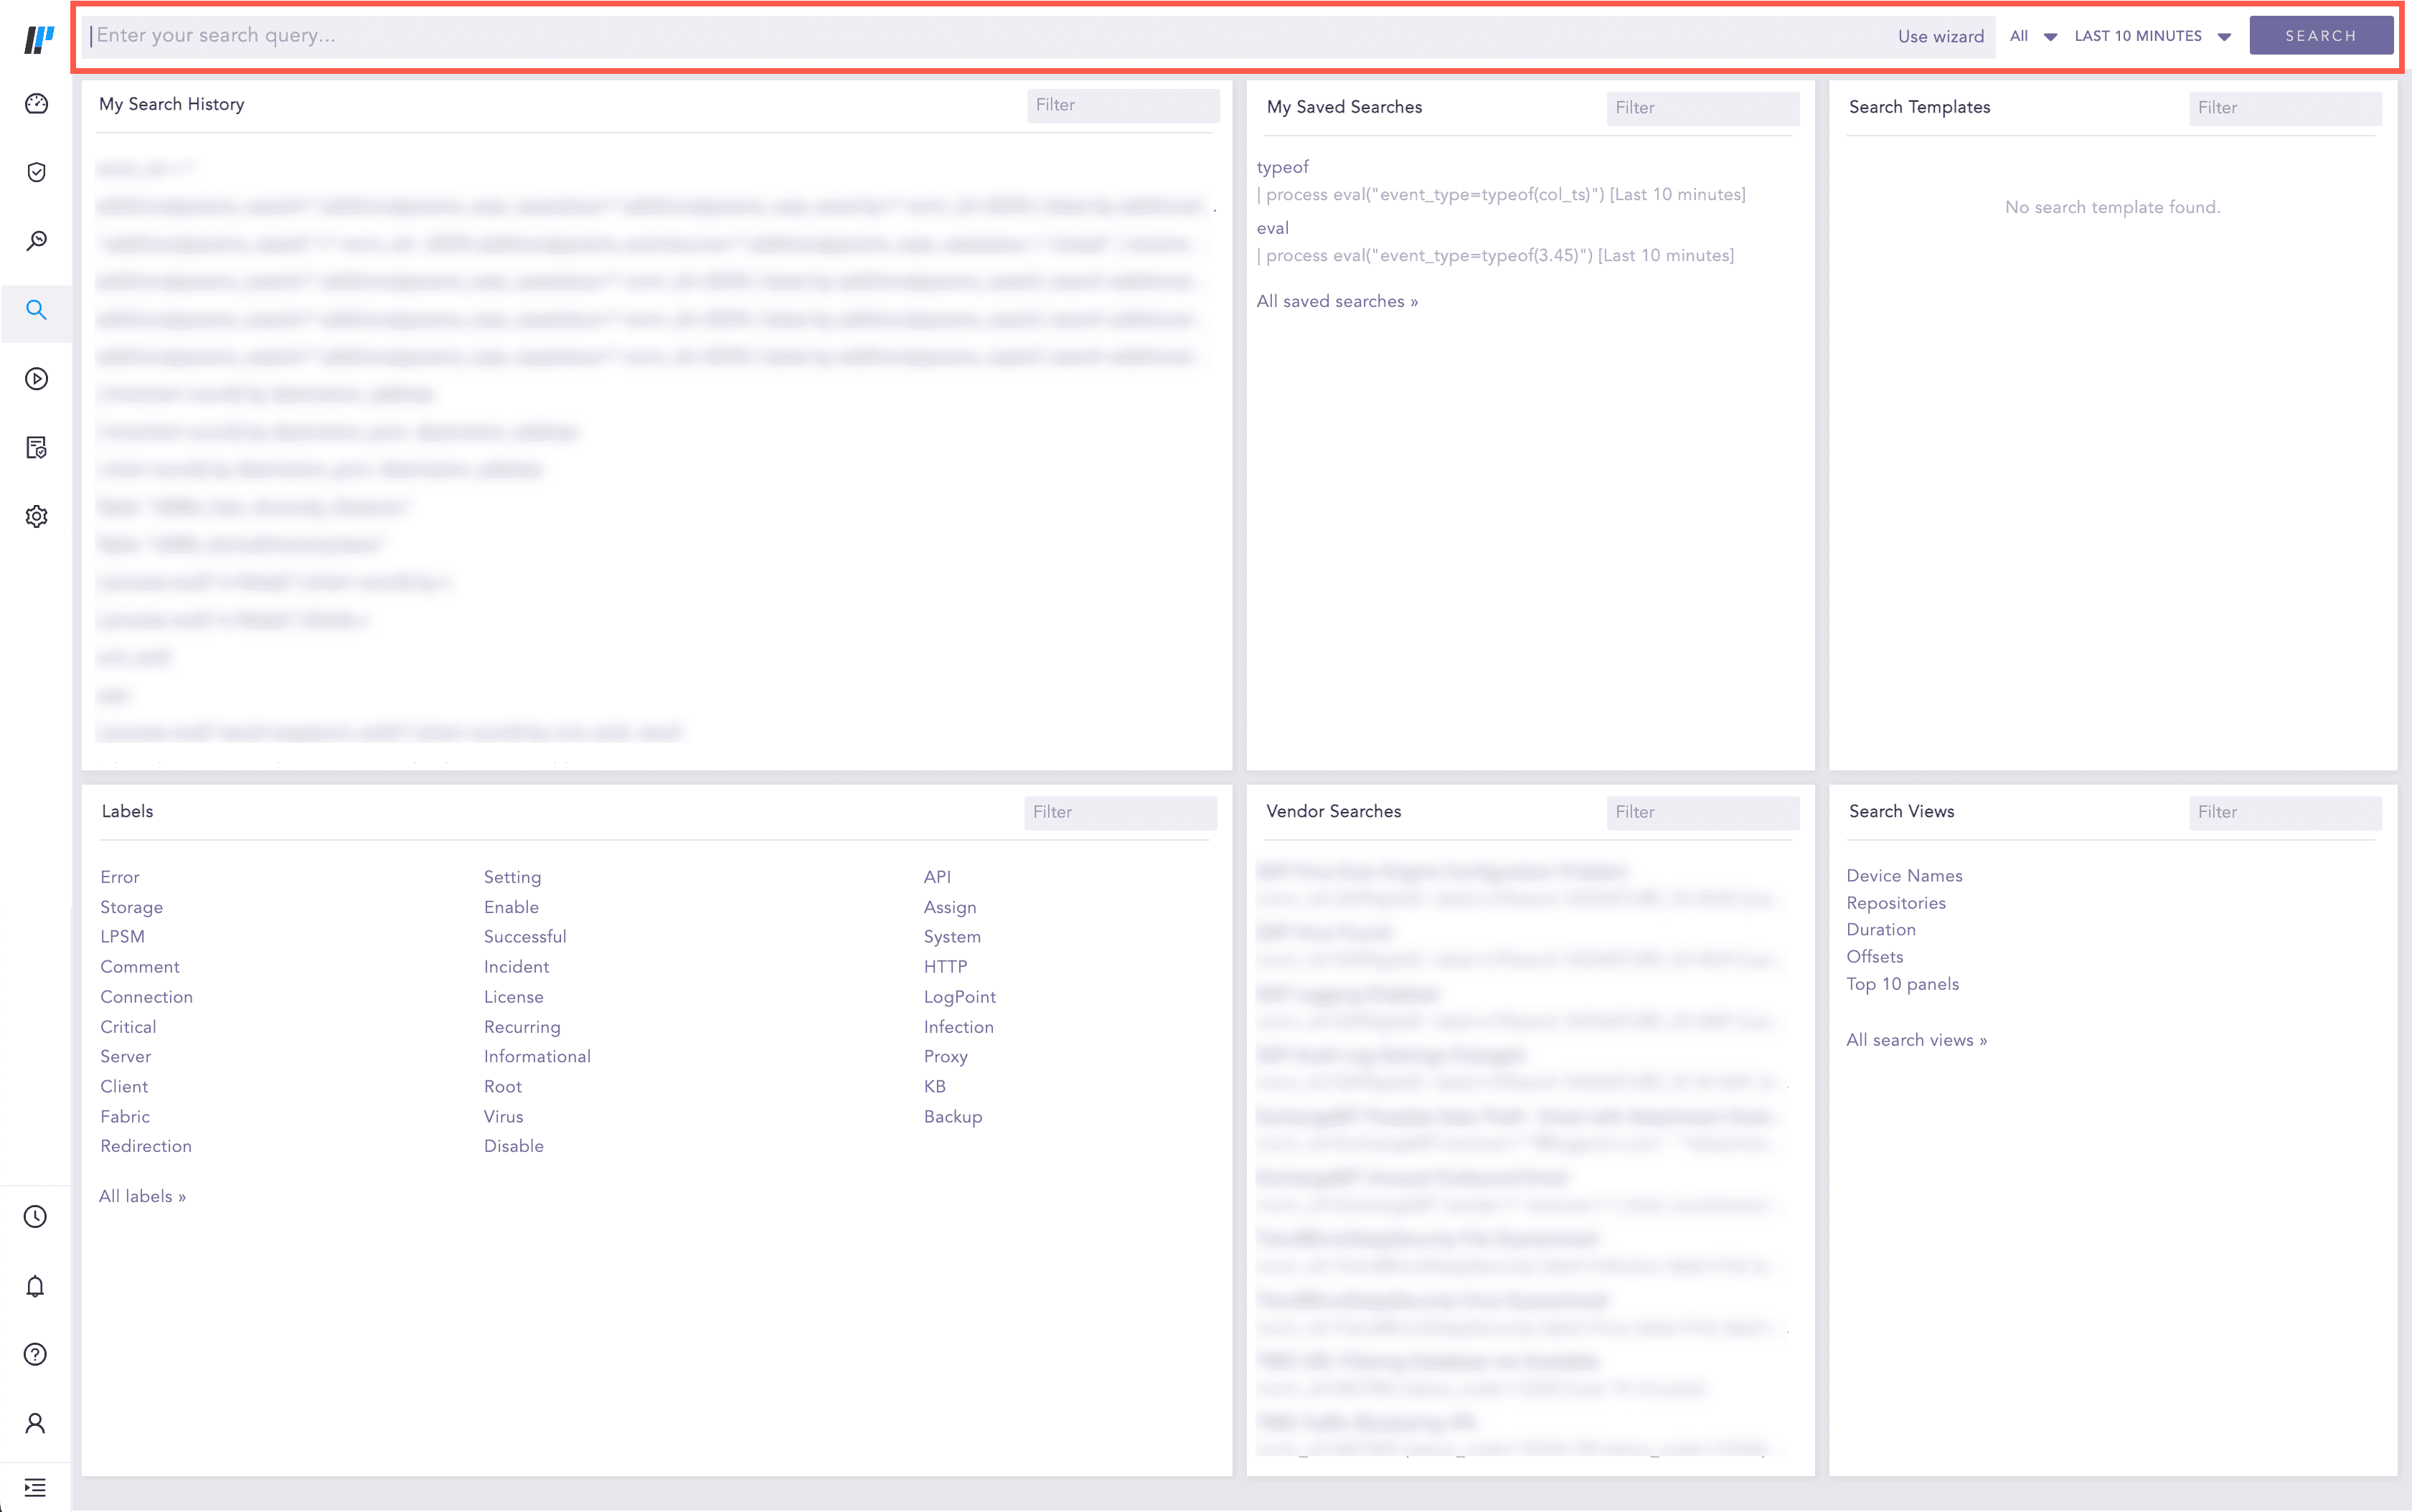
Search Bar lets you search the indexed logs. You can enter the query string in the search space.A Query String is a logical combination of words, phrases, or field values. You can either type a query string or build it to aggregate different values in the search result and display the result in a graphical format.
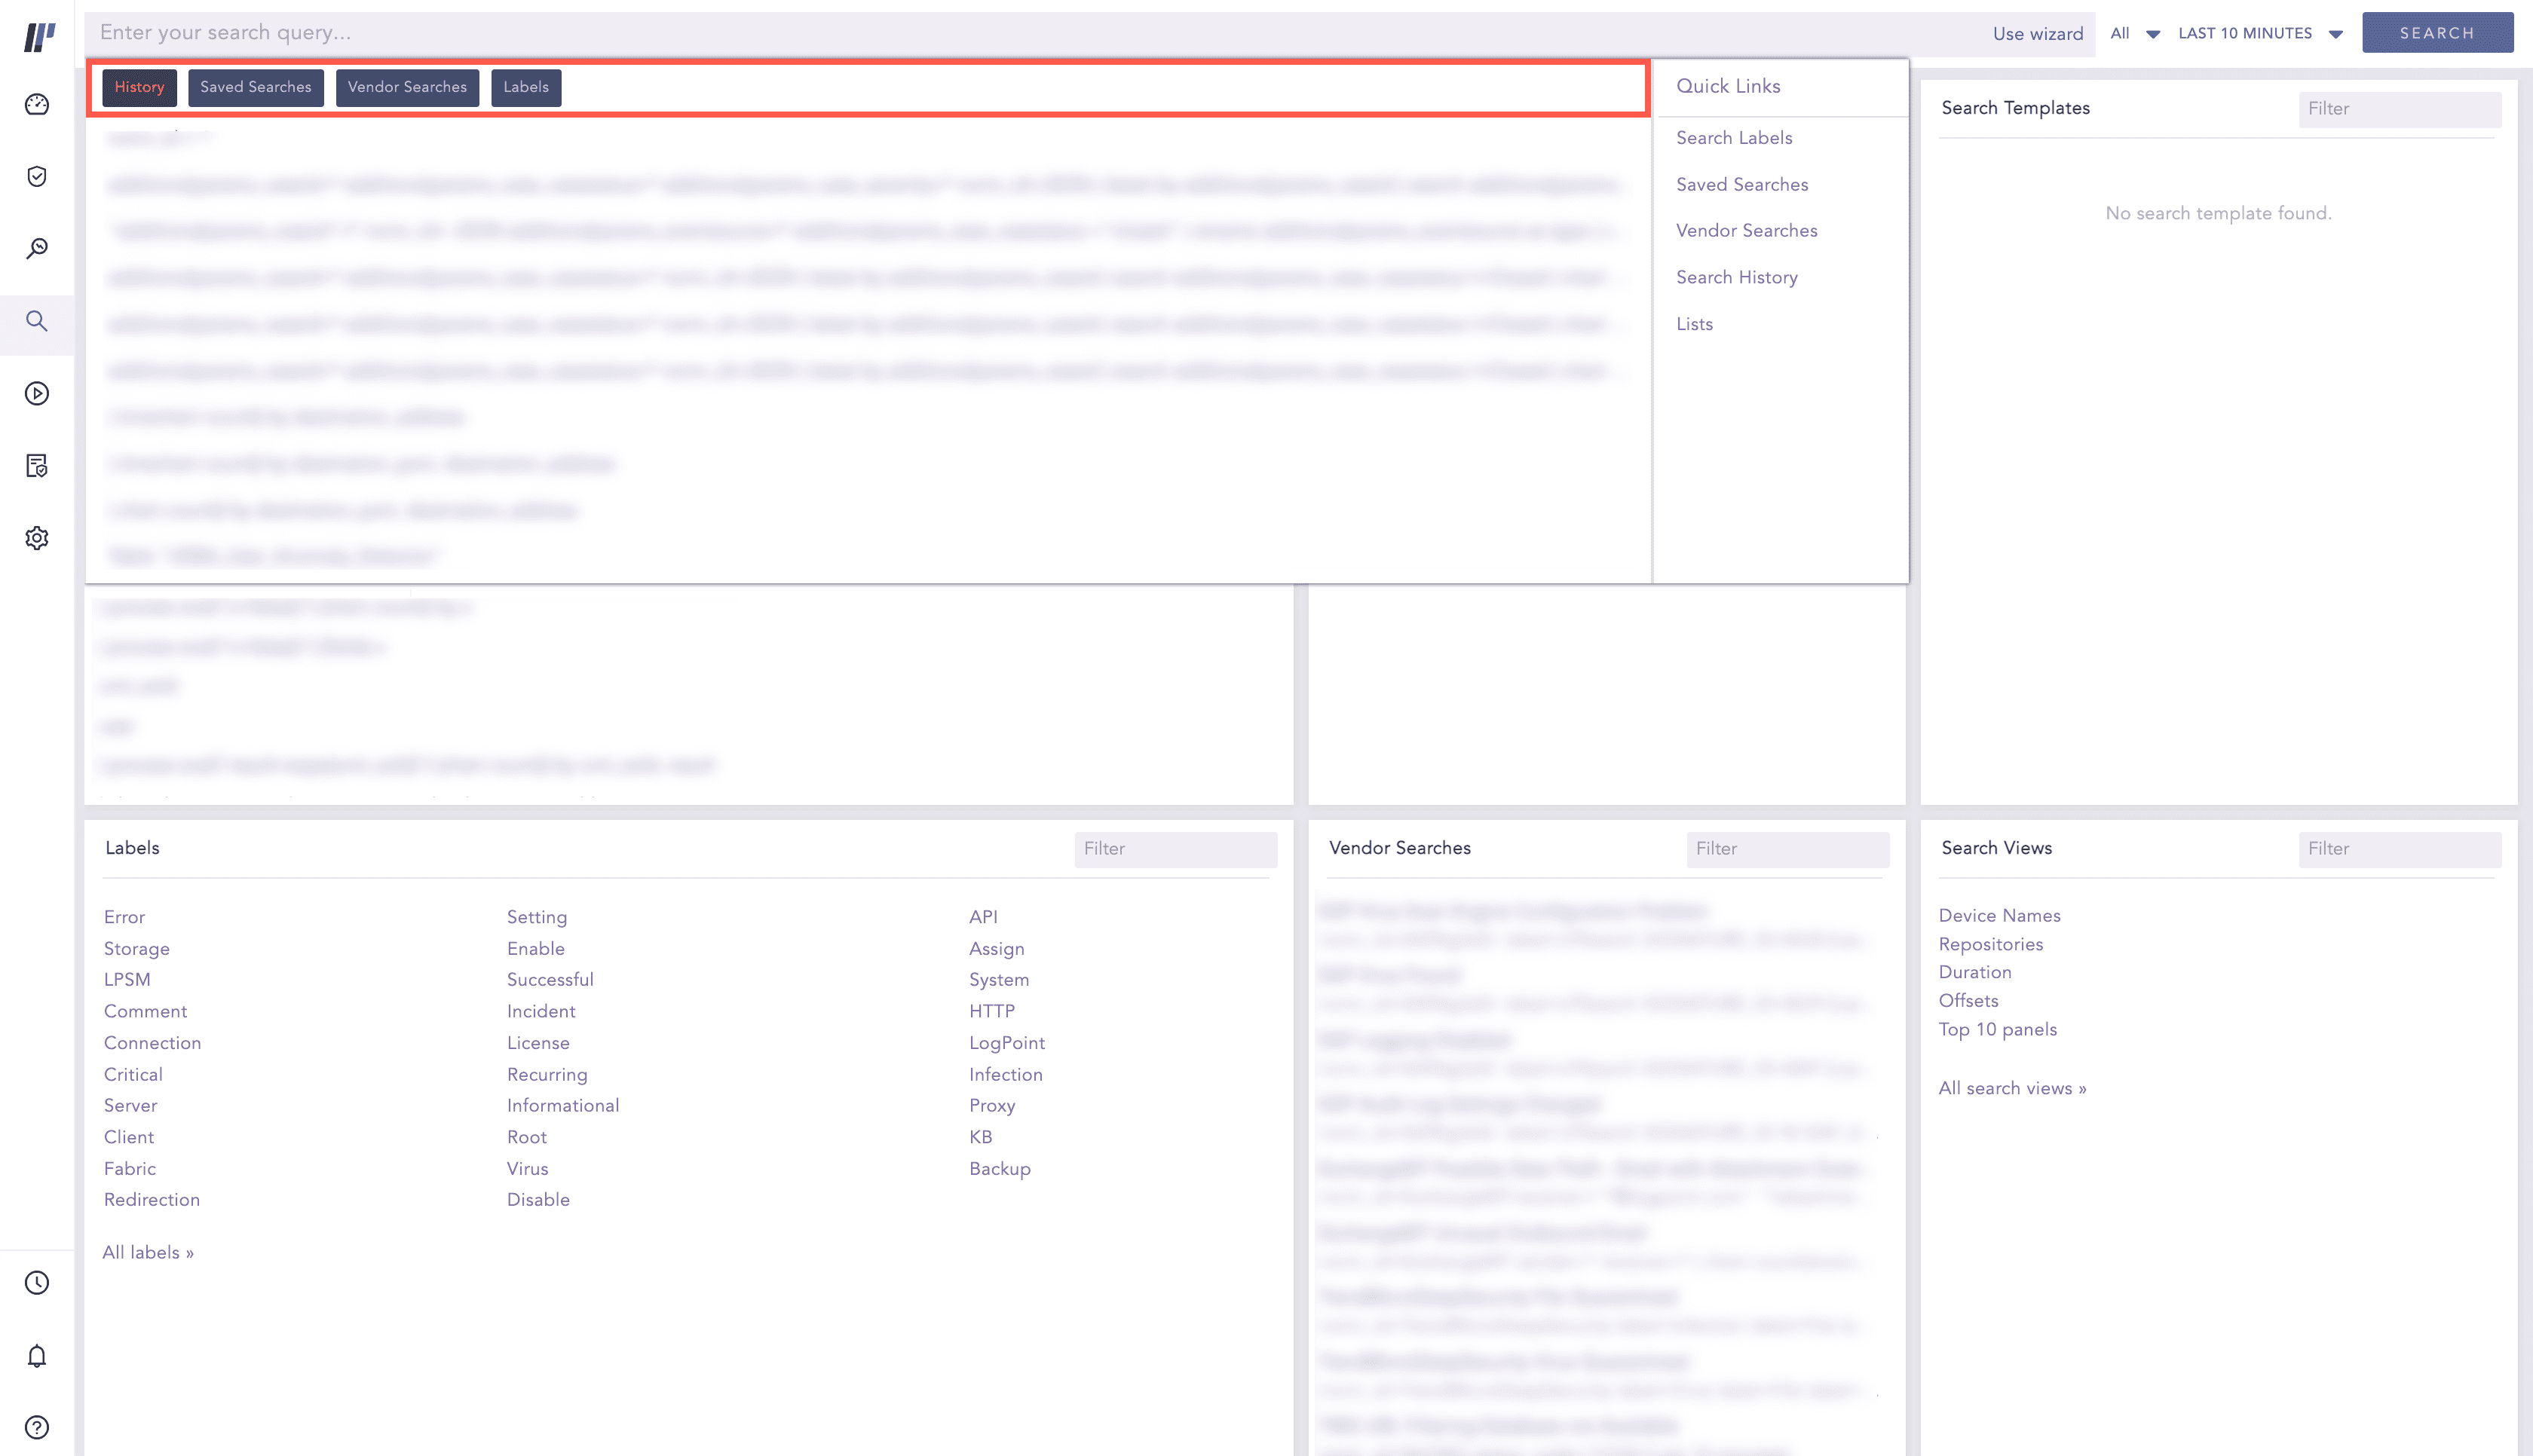
You can view History, Saved Searches, Vendor Searches, and Labels once you click on search bar.
You can write multiple queries using multiple lines. Press Shift + Enter to add a new line. The search bar can expand vertically up to 15 lines for your query. After that, a scroll bar appears to the right.

Multi-line Query
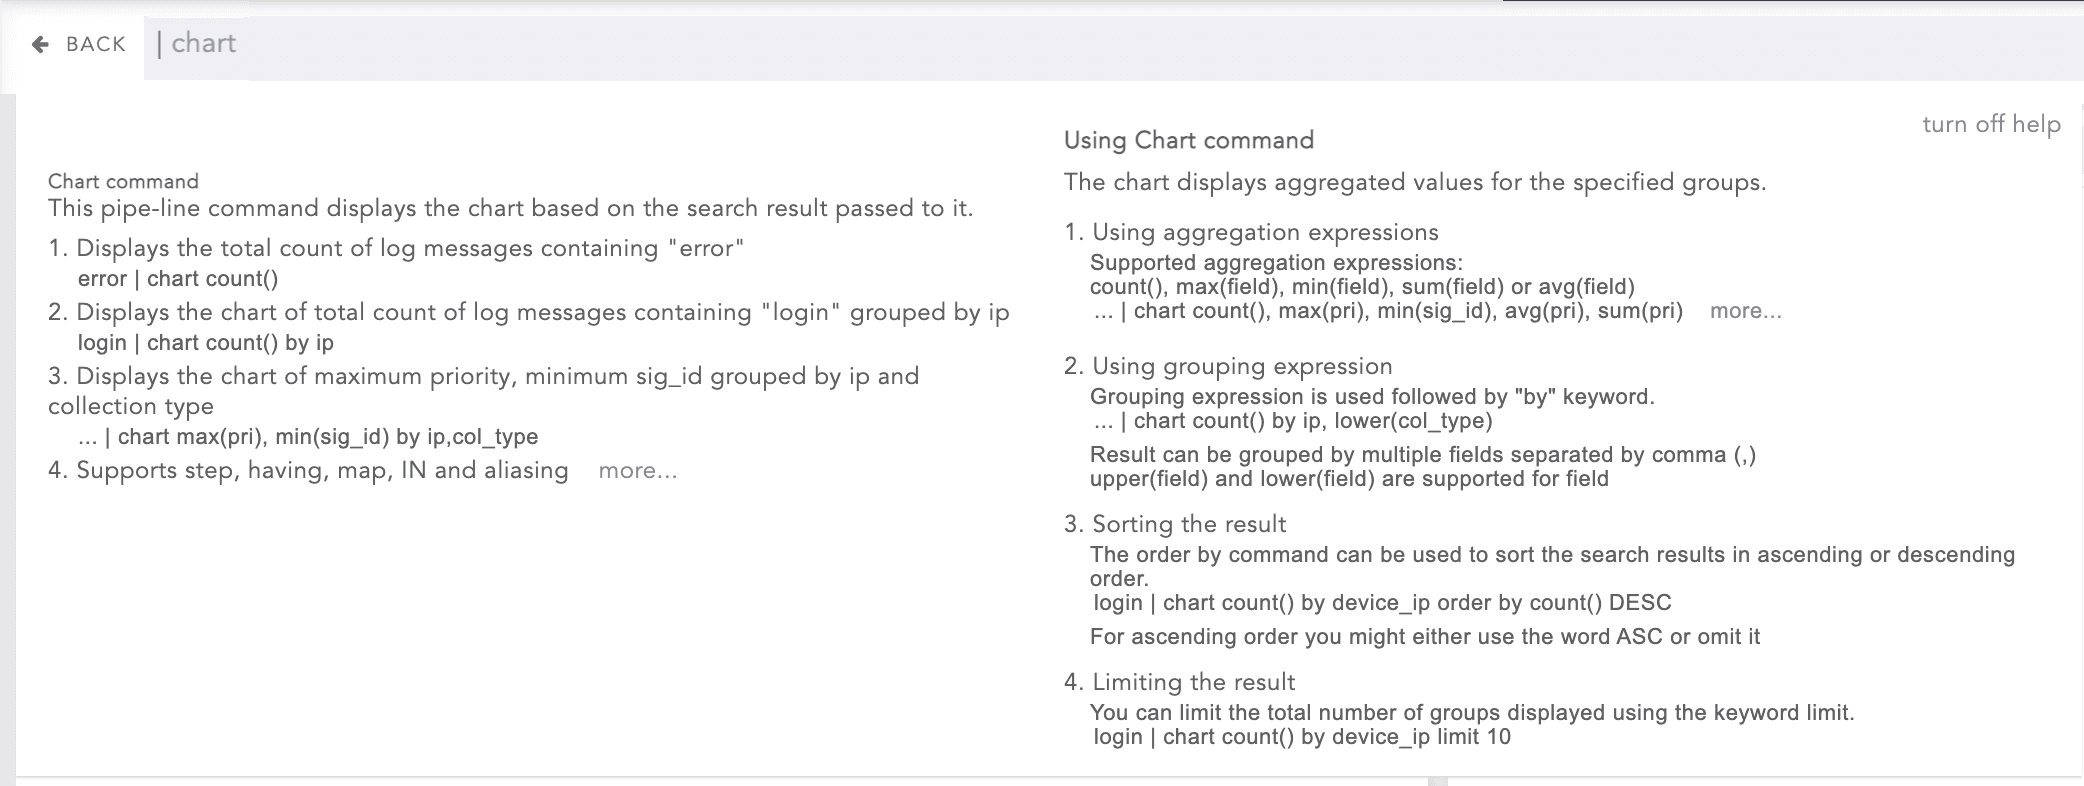
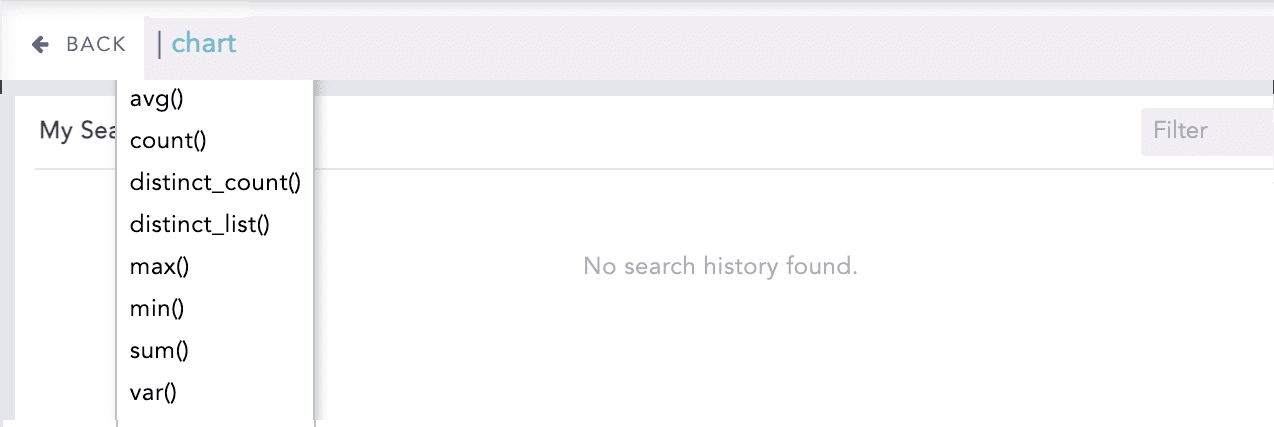
When you type a query, Logpoint auto-suggests keywords based on your input. Logpoint can display a detailed and dynamic search guide when you type a query in the search bar.
To enable the search guide, go to My Preferences >> Search.
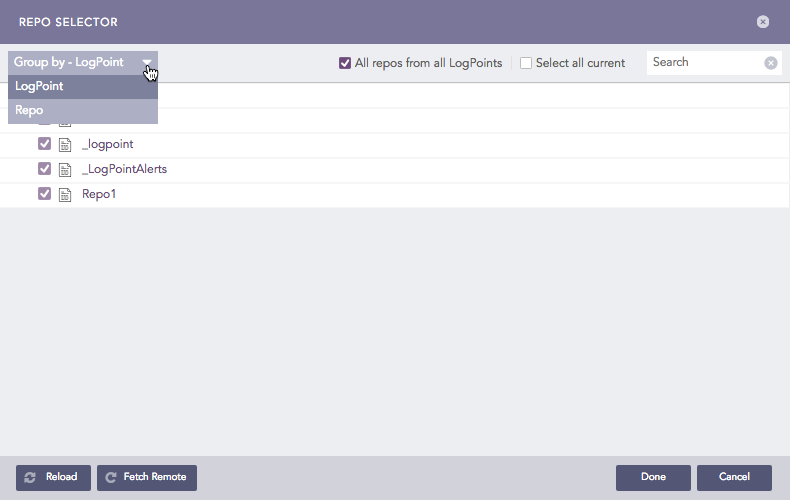
Repo Selector let’s you select where to search for logs.. Each repository collects the logs and stores them for a pre-defined period. Use the drop-down on the right to select multiple repositories. Choose only the required repos, otherwise performance is affected.
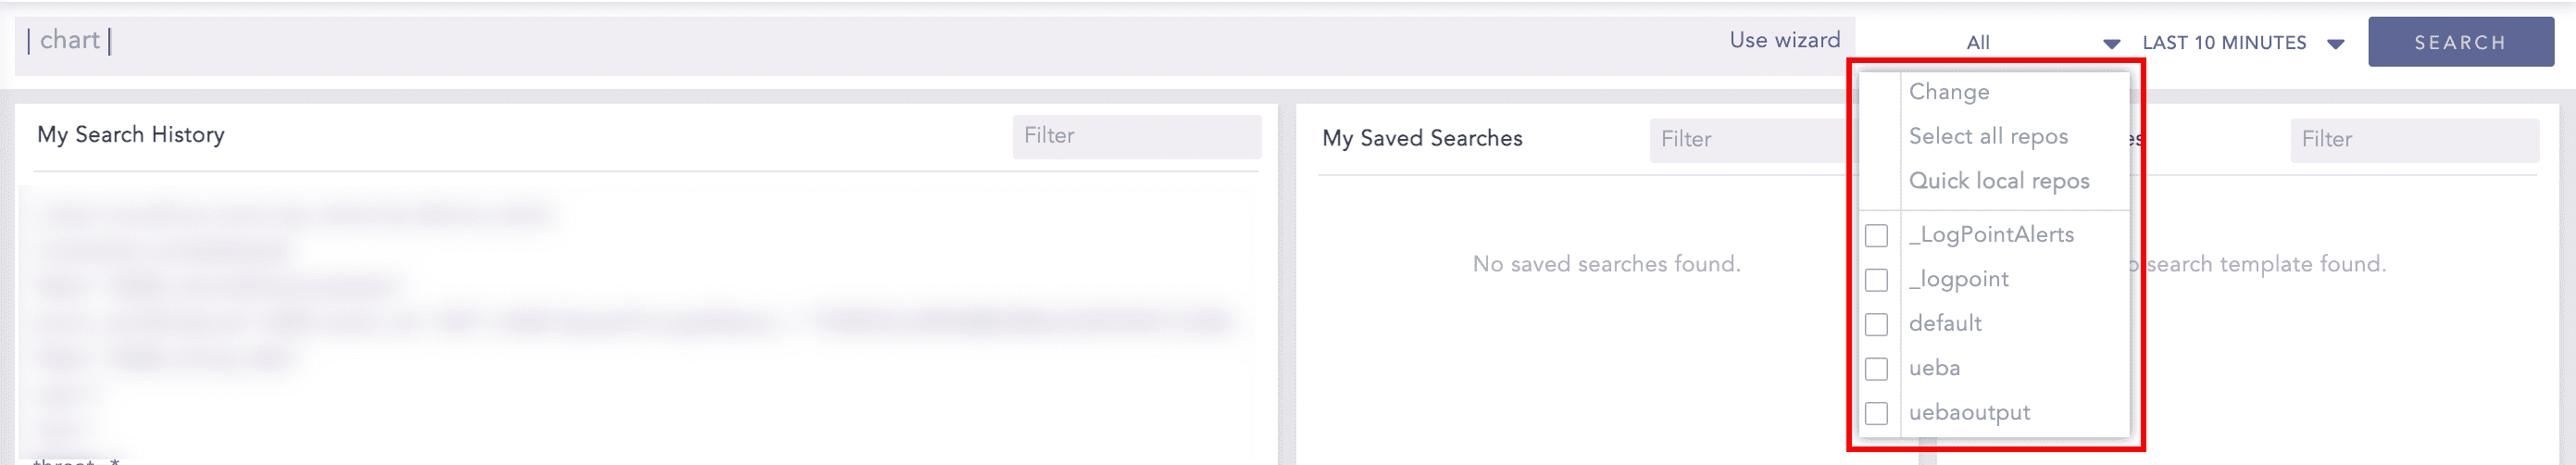
The repos in the Repo Selector are grouped either by Distributed Logpoints (DLP) or by Repo. From the Repo Selector, click Change to choose how the repos are grouped.
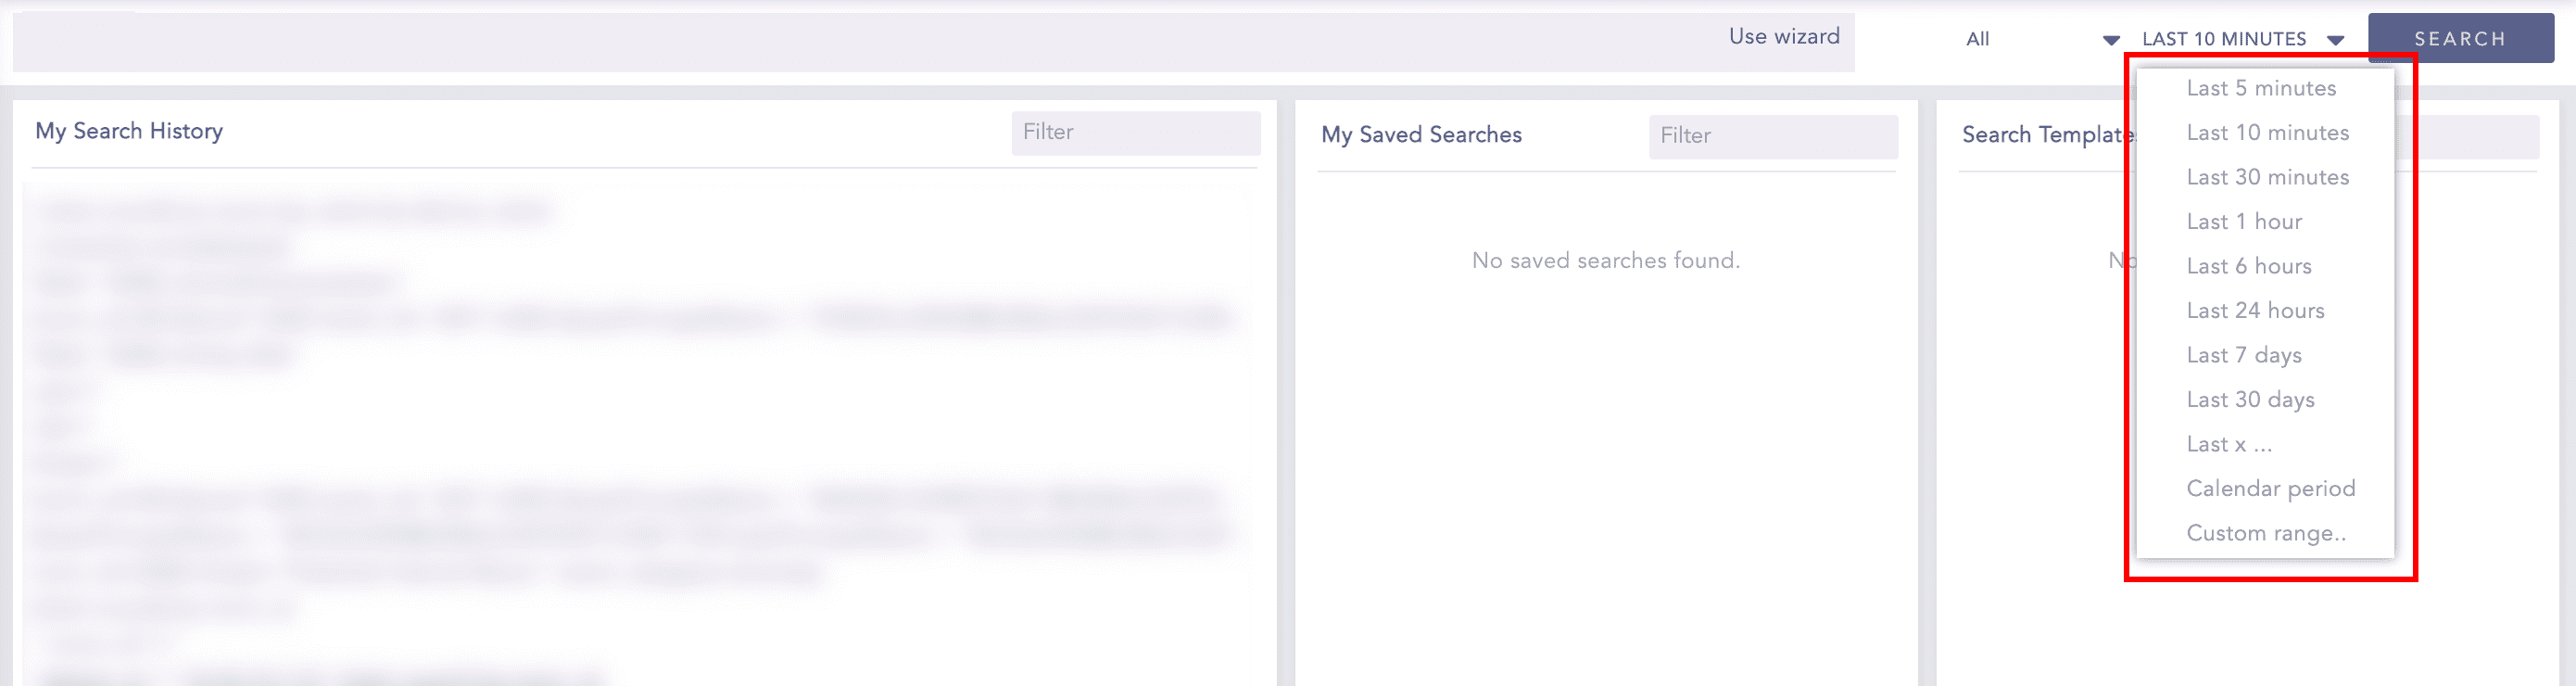
You can apply a Time range to your search. The default is Last 10 minutes. You can apply a time frame using the “Last x time-range” format, or select a custom time range of Last 1 hour, Last 6 hours, Last 7 days from the drop-down.
The Use Wizard helps you build a simple search query.
To use Use Wizard:
In the navigation bar, click Use Wizard.
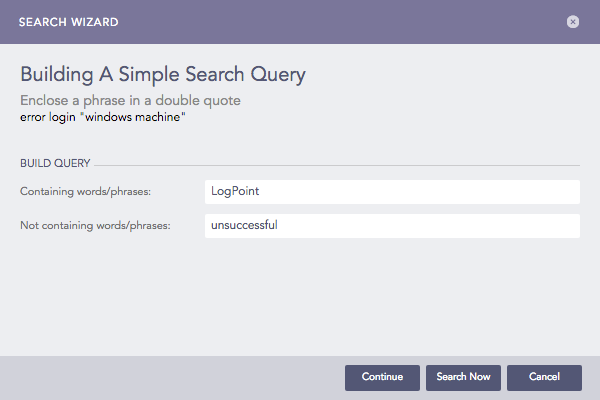
Search Wizard
Enter your search terms..
Enter the words/phrases that you want to exclude from the search.
Click Continue.
Note
You can click Search Now at any time while building the search query in this way. It searches for the logs using the query built up to that point in the process.
Select Visualization.
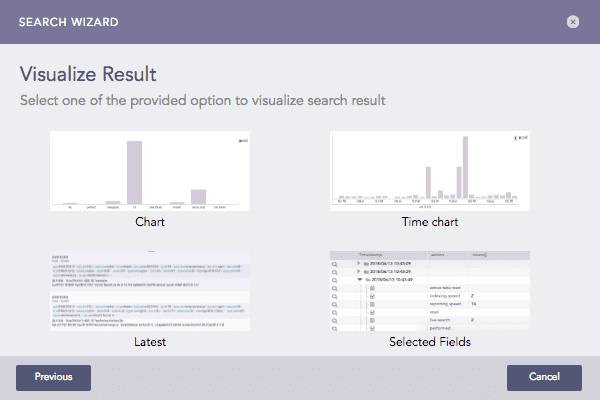
Viewing Options
Chart or Timechart
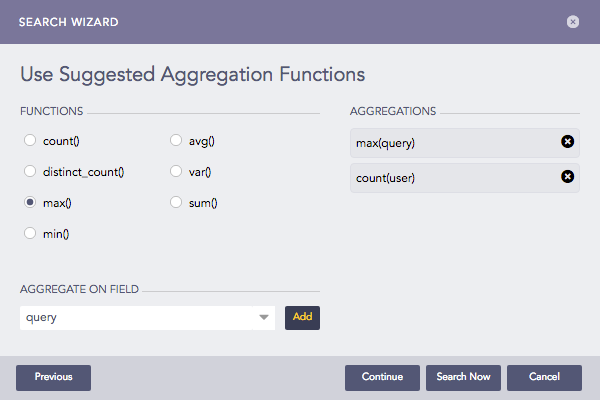
Select a Aggregation function and a Field.
Click Add.
Note
You can add multiple aggregation functions and fields. The aggregators are listed under AGGREGATIONS.
Click Continue.
Choose fields from which to Group the results.
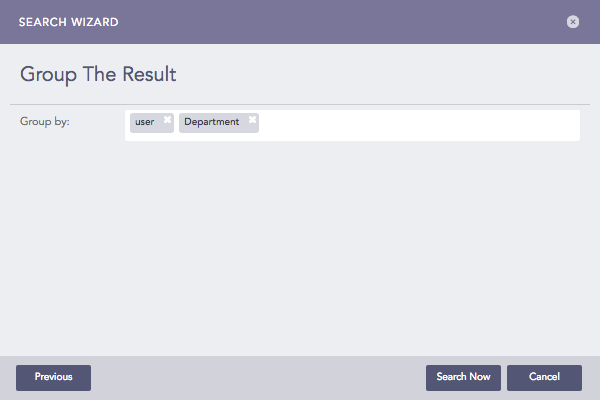
Click Search Now to get your visualization.
Latest
Select the fields from dropdown to Group the latest results.
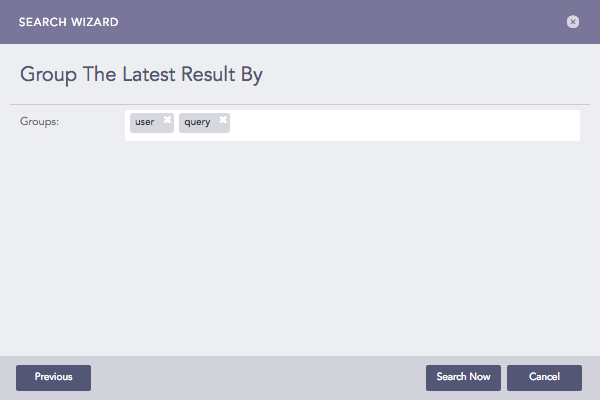
Click Search Now to get your visualization.
Selected Fields
Choose the Fields from the drop-down.
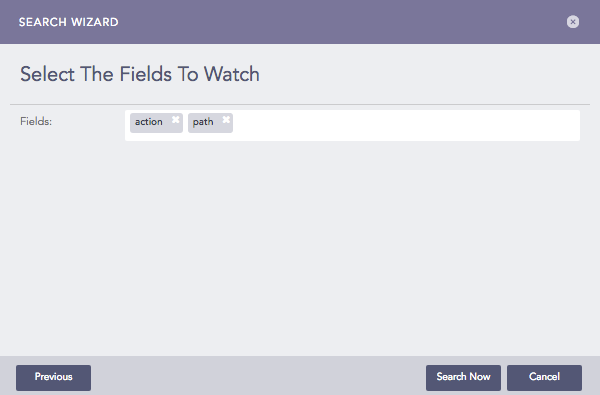
Click Search Now to get your visualization.
Note
In the Data Privacy Module enabled systems, you won’t be able to view the raw logs.